
A certificate of analysis for a synthetic peptide often leads with one big number: purity, for example 99.4%. It is natural to read that as “99.4% of this powder is the peptide”. It is not. HPLC purity and net peptide content are two different measurements that answer two different questions, and the gap between them can be large. This guide explains what each number means, what else is in a lyophilized peptide powder, and how peptide content is actually determined.
What HPLC purity measures
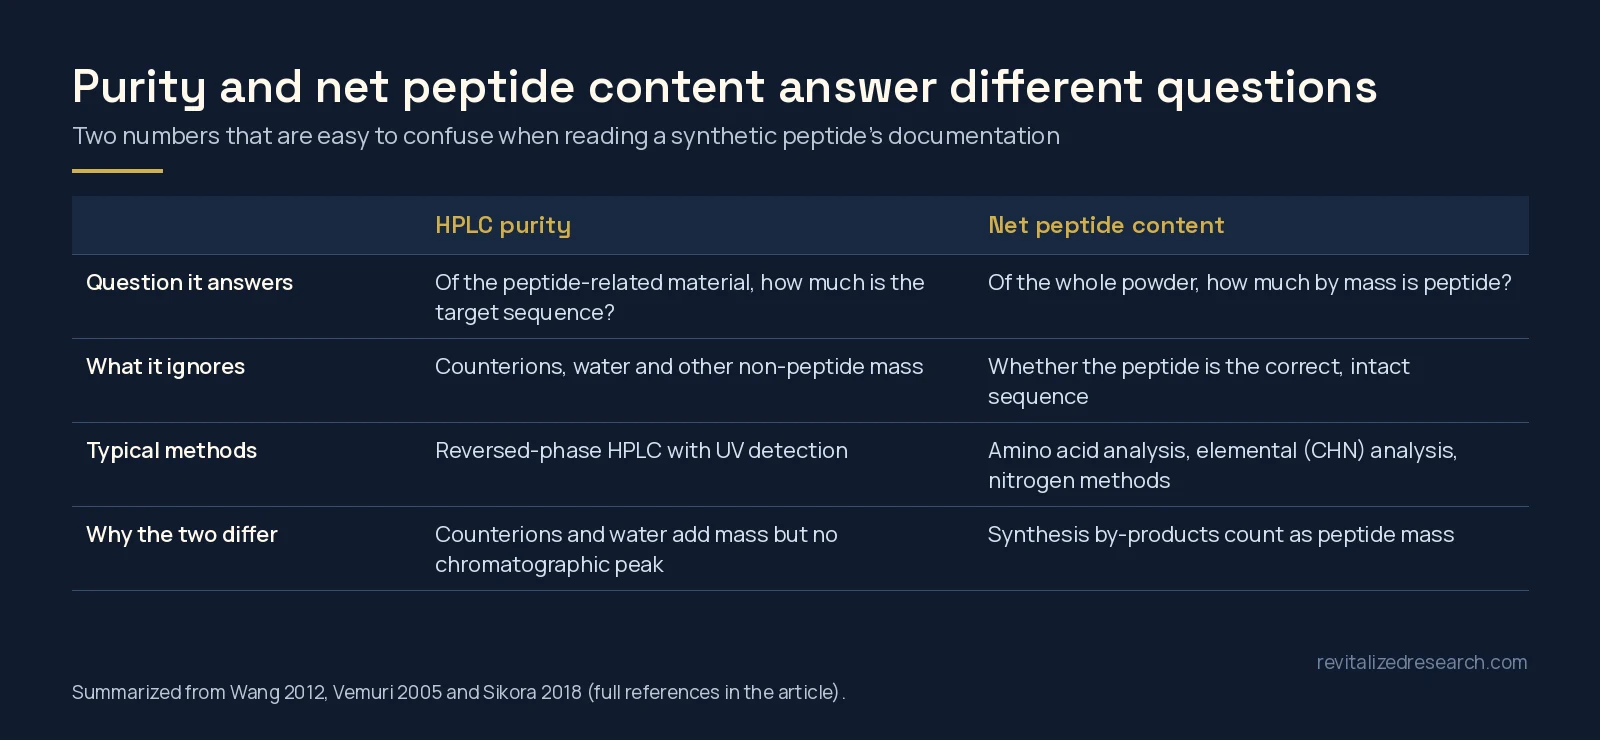
Purity by reversed-phase HPLC compares the area of the main peak with the areas of the other peptide-related peaks in the chromatogram. Those minor peaks are mostly synthesis and degradation by-products. Most peptides today are made by solid-phase synthesis, and the common by-products include deletion and insertion sequences, diastereomers from racemization, and products of incomplete deprotection [1]. A purity figure tells you how much of the peptide-related signal belongs to the target sequence.
What a purity figure does not see is anything that gives no peak under the detection conditions. Small inorganic or organic ions and water are the two big examples.
What else is in a peptide powder
Counterions
Synthetic peptides with basic groups are salts. Trifluoroacetate from cleavage and purification is almost always present in commercially synthesized peptides unless it has been exchanged [2], and exchanged forms carry acetate or chloride instead. The counterion adds mass to the powder but is not part of the peptide. Our guide to TFA vs acetate peptide salts covers where these ions come from and how they are measured.
Water
Lyophilized peptides still hold some water. Researchers describe a typical in vitro peptide sample as consisting of the peptide, its counterion and water [3]. Residual moisture is more than a bookkeeping issue: in a study of a freeze-dried model peptide, moisture level was one of the factors that changed how fast the peptide degraded in the solid state [4]. Residual moisture in freeze-dried materials is commonly measured by Karl Fischer and thermogravimetric methods [5].
How big is the gap?
It varies by sequence and processing, but it is rarely zero. In a study that measured synthetic peptides by acid hydrolysis followed by stable isotope dilution mass spectrometry, the peptides were above 99% pure by reversed-phase LC, yet their measured peptide content ranged from 62.07% to 88.18% [6]. In other words, a sample can be very pure and still be only about two-thirds peptide by mass.
That is why net peptide content matters whenever a lab needs an exact amount of peptide, for example to prepare a stock solution of known concentration. Weighing the powder and assuming it is all peptide can overstate the amount present.
How peptide content is determined
Amino acid analysis
Amino acid analysis (AAA) breaks the peptide into its amino acids with strong acid and heat, then quantifies the released amino acids against standards. In the isotope dilution study above, the optimized hydrolysis was 6 mol/L HCl at 150 °C for 4 to 6 hours, and two or more amino acids were used to make the result more reliable [6]. Hydrolysis is not perfectly clean: peptide bonds break at different rates and some amino acids partly decompose in acid, so serial hydrolysis times and correction factors are used to improve accuracy [7].
Detection method matters. Conventional AAA with absorbance or fluorescence detection can be limited to a few amino acids and not uncommonly shows coefficients of variation above 10%. An isobaric-tagged isotope dilution LC-MS/MS method reported an average CV of 3.57% across three peptides measured on seven different days [8].
Elemental analysis and nitrogen methods
Peptide content can also be calculated from the nitrogen, carbon and hydrogen in the sample. A comparison of four methods for lyophilized thymalfasin (thymosin alpha-1) looked at elemental CHN analysis, quantitative AAA, HPLC and Kjeldahl nitrogen. AAA was highly variable in one laboratory and quite precise in another, HPLC results also depended on the laboratory, while CHN analysis gave highly precise values with a coefficient of variation under 2% [9].
The lesson from both studies is the same: a peptide content figure is only as good as the method and laboratory behind it, so the report should name the method.
| Number on the report | What it tells you | What it does not tell you |
|---|---|---|
| HPLC purity (%) | Share of peptide-related signal from the target sequence | How much of the powder is peptide |
| Net peptide content (%) | Share of the powder mass that is peptide | Whether that peptide is the correct sequence |
| Observed mass (MS) | Whether the main component has the expected molecular mass | How pure or how concentrated the sample is |
| Water content (%) | Residual moisture, for example by Karl Fischer | Anything about the peptide itself |
Reading these numbers together
- Purity and identity first. Purity and an observed mass that matches the expected mass show you have the right, clean material. Our HPLC vs mass spectrometry guide explains how those two methods split the work.
- Content when quantity matters. If your protocol depends on an exact amount, look for a net peptide content result and its method, or plan to measure it.
- Same lot, same numbers. Every figure only describes the batch it was run on. See how to verify a peptide COA for matching a report to your lot.
- Keep it dry. Because water adds mass and can speed degradation, keep vials sealed, cold and dry, as covered in peptide storage basics.
Lot-level purity and identity results for our catalog, such as BPC-157 and TB-500, are published in the Revitalized Research COA library.
All Revitalized Research products are sold for laboratory research use only. They are not for human or veterinary use. This article describes analytical chemistry and does not make any claim about biological effects.
Frequently asked questions
What is the difference between peptide purity and net peptide content?
HPLC purity is the share of the peptide-related signal that belongs to the target sequence. Net peptide content is the share of the whole powder, by mass, that is peptide. Counterions and water count against content but do not show up in purity.
Why is net peptide content lower than purity?
A lyophilized peptide powder also contains counterions, such as trifluoroacetate or acetate, and some residual water. These add mass without adding peptide, so content is usually well below the purity figure.
How is net peptide content measured?
The usual methods are amino acid analysis after acid hydrolysis, elemental (CHN) analysis and nitrogen determination. Precision depends strongly on the method and the laboratory, so a report should name the method used.
Can a peptide be 99% pure but contain much less peptide by mass?
Yes. In one published study, synthetic peptides above 99% purity by reversed-phase LC had measured peptide contents between about 62% and 88%.
Does water content matter for lyophilized peptides?
Yes. Water adds mass to the powder, and studies of freeze-dried model peptides show that residual moisture can change how fast a peptide degrades in the solid state.
References
- D’Hondt M, Bracke N, Taevernier L et al. (2014). Related impurities in peptide medicines. J Pharm Biomed Anal. PMID: 25044089. doi: 10.1016/j.jpba.2014.06.012.
- Andrushchenko VV, Vogel HJ, Prenner EJ (2007). Optimization of the hydrochloric acid concentration used for trifluoroacetate removal from synthetic peptides. J Pept Sci. PMID: 17031869. doi: 10.1002/psc.793.
- Sikora K, Jaśkiewicz M, Neubauer D et al. (2018). Counter-ion effect on antistaphylococcal activity and cytotoxicity of selected antimicrobial peptides. Amino Acids. PMID: 29307075. doi: 10.1007/s00726-017-2536-9.
- Oliyai C, Patel JP, Carr L et al. (1994). Chemical pathways of peptide degradation. VII. Solid state chemical instability of an aspartyl residue in a model hexapeptide. Pharm Res. PMID: 7937533. doi: 10.1023/a:1018998312503.
- May JC, Grim E, Wheeler RM et al. (1982). Determination of residual moisture in freeze-dried viral vaccines: Karl Fischer gravimetric and thermogravimetric methodologies. J Biol Stand. PMID: 7130203. doi: 10.1016/s0092-1157(82)80026-7.
- Wang X, Qin W, Qian X et al. (2012). [Accurate quantification of synthetic peptides by amino acid-stable isotope dilution mass spectrometry]. Se Pu. PMID: 22715687. doi: 10.3724/sp.j.1123.2012.01035.
- Darragh AJ, Moughan PJ (2005). The effect of hydrolysis time on amino acid analysis. J AOAC Int. PMID: 16001867.
- Woolfitt AR, Solano MI, Williams TL et al. (2009). Amino acid analysis of peptides using isobaric-tagged isotope dilution LC-MS/MS. Anal Chem. PMID: 19364092. doi: 10.1021/ac900367q.
- Vemuri S (2005). Comparison of assays for determination of peptide content for lyophilized thymalfasin. J Pept Res. PMID: 15813890. doi: 10.1111/j.1399-3011.2005.00225.x.