
Two lyophilized peptides of similar size can behave very differently once a lab puts them into solution. One dissolves in seconds; the other leaves a haze or a film on the glass. The difference usually comes down to chemistry: the sequence, its net charge at the working pH, and how strongly the chains attract each other. This guide explains the main drivers of peptide solubility, why peptides aggregate, and how laboratories detect aggregates.
Sequence is the starting point
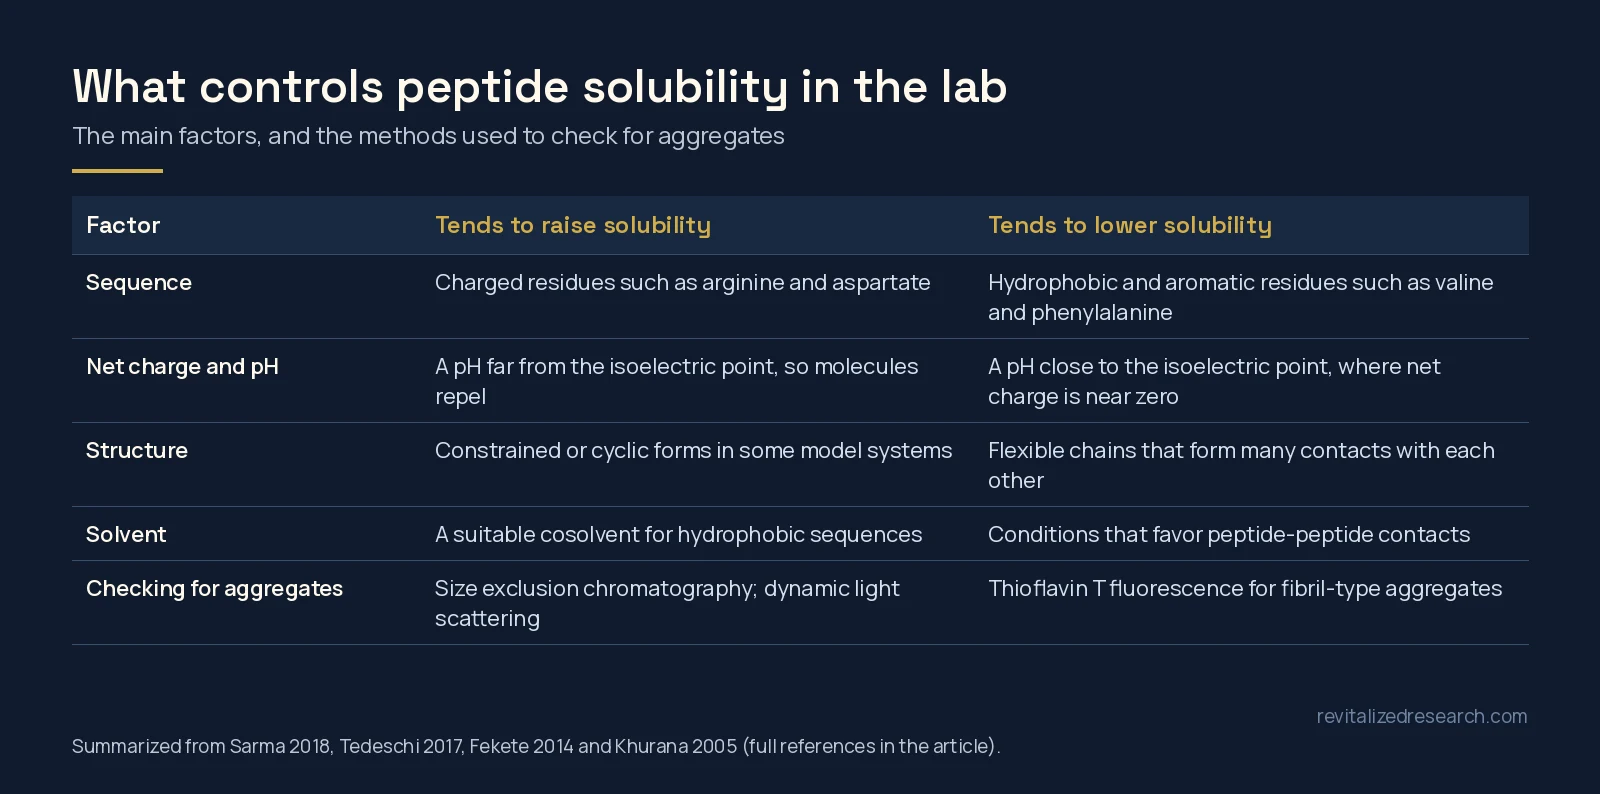
Each amino acid pulls solubility up or down. In a simulation study of model pentapeptides (GGXGG), the order of solubility limits was arginine > aspartate > glycine > valine > glutamine > asparagine > phenylalanine, matching the order reported experimentally for the free amino acids. The more soluble peptides also spent less time inside aggregated clusters [1].
Hydrophobicity is the same property that controls how strongly a peptide is retained in reversed-phase chromatography, and it has been studied from simple amino acid solubility through to computational and machine-learning models [2]. In practice, a peptide that elutes late on a reversed-phase HPLC trace is usually more hydrophobic than one that elutes early.
Sequence-based tools can now estimate solubility before any material is handled. One published method, CamSol-PTM, predicts the intrinsic solubility of peptides in water at room temperature, including peptides that contain modified or non-natural amino acids [3].
Net charge and pH
Charge keeps peptide molecules apart. In a study of a series of model proteins with the same hydrophobicity but different net charge per residue, solubility reached a minimum close to each protein’s isoelectric point (pI), the pH at which its net charge is zero [4]. Moving the pH away from the pI increases net charge and repulsion between molecules.
The rule is useful but not absolute. In salting-out experiments with several proteins, neither aggregate nor crystal solubility showed a minimum at the isoelectric point, and interactions became more attractive as pH decreased [5]. Salt concentration and the specific sequence both change the picture.
Examples from our catalog show how much composition varies. Selank (Thr-Lys-Pro-Arg-Pro-Gly-Pro) is short and carries basic lysine and arginine residues. Mots-C (MRWQEMGYIFYPRKLR) combines several aromatic residues with basic arginine and lysine. Semax (Met-Glu-His-Phe-Pro-Gly-Pro) mixes an acidic glutamate with a histidine and a phenylalanine.
Structure and the counterion
Shape matters too. In simulations of a five-glycine peptide, the cyclic form phase-separated less readily and had a higher water solubility than the linear form, because the linear chains formed many more contacts with each other [6]. The counterion carried by a synthetic peptide can also affect its secondary structure and behavior in assays [7]; our TFA vs acetate guide covers those salt forms.
Solvents and cosolvents
For hydrophobic sequences, labs often use a small proportion of an organic cosolvent. The effect of a cosolvent on aggregation can be described through how it changes the solvation free energy of the peptide compared with pure water [8], which is why a cosolvent can shift a peptide from clumping to staying in solution.
Solvent choice can also change the peptide chemically. A mixture of dimethyl sulfoxide (DMSO) and concentrated hydrochloric acid oxidizes tryptophan to oxindolylalanine and converts methionine and cysteine to methionine sulfoxide and cystine [9]. Conditions like these are used deliberately in synthesis chemistry, and they are a reminder that oxidation-prone residues deserve care, as described in our oxidation vs deamidation guide.
How labs detect aggregation
Size exclusion chromatography
Size exclusion chromatography (SEC) separates molecules by size and is considered a reference technique for evaluating aggregates, mainly because its mild mobile phases have minimal impact on structure [10]. Coupling SEC to native electrospray mass spectrometry can show whether small aggregates were present in the sample or only formed during ionization [11].
Dynamic light scattering
Dynamic light scattering (DLS) is quick and widely used, but its numbers need care. Scattered light intensity rises with the sixth power of particle size, so a few large particles dominate the signal. In a lysozyme solution, DLS overestimated mean cluster size by about 1.6 times and underestimated cluster concentration by about 10 times compared with direct microscopy [12].
Thioflavin T fluorescence
Thioflavin T is a dye whose fluorescence increases when it binds amyloid-type fibrils, and it is commonly used to monitor fibril formation. At the concentrations typically used in these assays, around 10 to 20 µM, the dye itself forms micelles, with a critical micellar concentration of about 4 µM, which affects how the signal should be read [13].
| Method | What it shows | Main limitation |
|---|---|---|
| SEC | Monomer and aggregate peaks separated by size | Peak shape is hard to predict; needs method development |
| DLS | Particle size distribution in solution | Biased toward large particles |
| Thioflavin T | Fibril-type (amyloid-like) aggregates | Does not detect every kind of aggregate |
| Visual check | Haze, particles or film | Misses small soluble aggregates |
Practical points for the lab
- Read the sequence first. Count charged and hydrophobic residues and estimate the pI before choosing a buffer.
- Work away from the pI where the assay allows it, and record pH and salt conditions.
- Choose solvents with the residues in mind, especially methionine, cysteine and tryptophan.
- Confirm the material. Solubility problems are a separate question from purity and identity, which come from the lot’s analytical data. See how to read a peptide COA.
Purity and identity results for each lot in our catalog are in the Revitalized Research COA library.
All Revitalized Research products are sold for laboratory research use only. They are not for human or veterinary use. This article describes analytical chemistry and does not make any claim about biological effects.
Frequently asked questions
What determines peptide solubility?
The main factors are the amino acid sequence, the peptide’s net charge at the working pH, its structure and the solvent. Charged residues such as arginine and aspartate tend to raise solubility, while hydrophobic and aromatic residues tend to lower it.
Why are peptides less soluble near their isoelectric point?
At the isoelectric point the net charge is close to zero, so molecules repel each other less and are more likely to stick together. Published work shows a solubility minimum near the pI for many proteins, although salt and sequence can change this.
What is peptide aggregation?
Aggregation is peptide molecules associating with each other into clusters, from small soluble oligomers to visible particles or fibrils. It is driven by the same forces that lower solubility, especially hydrophobic contacts.
How do labs check a peptide solution for aggregates?
Common methods are size exclusion chromatography, dynamic light scattering and thioflavin T fluorescence for fibril-type aggregates. Each has limits, so labs often combine more than one.
Can a solvent change a peptide chemically?
Yes. For example, dimethyl sulfoxide combined with concentrated hydrochloric acid oxidizes tryptophan, methionine and cysteine, so solvent choice matters for sequences that contain those residues.
References
- Sarma R, Wong KY, Lynch GC et al. (2018). Peptide Solubility Limits: Backbone and Side-Chain Interactions. J Phys Chem B. PMID: 29384681. doi: 10.1021/acs.jpcb.7b10734.
- Al Musaimi O, Valenzo OMM, Williams DR (2023). Prediction of peptides retention behavior in reversed-phase liquid chromatography based on their hydrophobicity. J Sep Sci. PMID: 36349538. doi: 10.1002/jssc.202200743.
- Oeller M, Kang RJD, Bolt HL et al. (2023). Sequence-based prediction of the intrinsic solubility of peptides containing non-natural amino acids. Nat Commun. PMID: 37978172. doi: 10.1038/s41467-023-42940-w.
- Tedeschi G, Mangiagalli M, Chmielewska S et al. (2017). Aggregation properties of a disordered protein are tunable by pH and depend on its net charge per residue. Biochim Biophys Acta Gen Subj. PMID: 28890401. doi: 10.1016/j.bbagen.2017.09.002.
- Dumetz AC, Chockla AM, Kaler EW et al. (2008). Effects of pH on protein-protein interactions and implications for protein phase behavior. Biochim Biophys Acta. PMID: 18258214. doi: 10.1016/j.bbapap.2007.12.016.
- Workman RJ, Gorle S, Pettitt BM (2022). Effects of Conformational Constraint on Peptide Solubility Limits. J Phys Chem B. PMID: 36450134. doi: 10.1021/acs.jpcb.2c06458.
- Sikora K, Jaśkiewicz M, Neubauer D et al. (2018). Counter-ion effect on antistaphylococcal activity and cytotoxicity of selected antimicrobial peptides. Amino Acids. PMID: 29307075. doi: 10.1007/s00726-017-2536-9.
- Matubayasi N, Masutani K (2019). Energetics of cosolvent effect on peptide aggregation. Biophys Physicobiol. PMID: 31984171. doi: 10.2142/biophysico.16.0_185.
- Savige WE, Fontana A (1980). Oxidation of tryptophan to oxindolylalanine by dimethyl sulfoxide-hydrochloric acid. Selective modification of tryptophan containing peptides. Int J Pept Protein Res. PMID: 6155358. doi: 10.1111/j.1399-3011.1980.tb02579.x.
- Fekete S, Beck A, Veuthey JL et al. (2014). Theory and practice of size exclusion chromatography for the analysis of protein aggregates. J Pharm Biomed Anal. PMID: 24816223. doi: 10.1016/j.jpba.2014.04.011.
- Muneeruddin K, Thomas JJ, Salinas PA et al. (2014). Characterization of small protein aggregates and oligomers using size exclusion chromatography with online detection by native electrospray ionization mass spectrometry. Anal Chem. PMID: 25310183. doi: 10.1021/ac502590h.
- Li Y, Lubchenko V, Vekilov PG (2011). The use of dynamic light scattering and brownian microscopy to characterize protein aggregation. Rev Sci Instrum. PMID: 21639491. doi: 10.1063/1.3592581.
- Khurana R, Coleman C, Ionescu-Zanetti C et al. (2005). Mechanism of thioflavin T binding to amyloid fibrils. J Struct Biol. PMID: 16125973. doi: 10.1016/j.jsb.2005.06.006.